Dealing with scammers effectively is a priority for most businesses. Throughout industries there are a variety of approaches that have proved successful. A common thread within these approaches is the importance of timely and insightful reports that summarize the situation, allow for productive reviews and encourage inventive strategies.
For some time, Red Points has been providing customers with excellent reporting capabilities, allowing business executives and brand owners to protect their revenue and brand. Now with Red Points’ new anti-fraud dashboards we are taking that next step to enhance reporting capabilities and provide insights to proactively safeguard businesses and pursue wrongdoers.
In this blog we’ll be exploring Red Points’ new anti-fraud dashboards by highlighting a number of topics, including:
- Peek into the future: what the new anti-fraud dashboards have in store for you
- A breakdown of the Dashboards
Peek into the future: what the new anti-fraud dashboards have in store for you
Our new anti-fraud dashboards are here and they are ready to help you unlock your business’s potential to tackle fraudsters and plan for the future. While we have a strong history of providing insights, the new version of our dashboards optimize our reporting capabilities and enable users to access enhanced reporting interfaces.
Our six anti-fraud dashboards are:
- Summary
- Result Analysis
- Non-enforceable
- Links & Docs
- Economic Impact
- Custom Reports
Each dashboard is designed to deliver unique and insightful information that will help you understand your anti-fraud coverage and prepare your business to combat scammers for many years to come.
Depending on your priorities, you may turn to Result Analysis to learn about specific incidents or you might focus on the Non-enforceable dashboard to learn more about your intellectual property (IP) rights. Below we breakdown the dashboards revamp, highlighting everything you need to know about our new and improved approach to reporting.

A breakdown of the anti-fraud dashboards
1. Summary
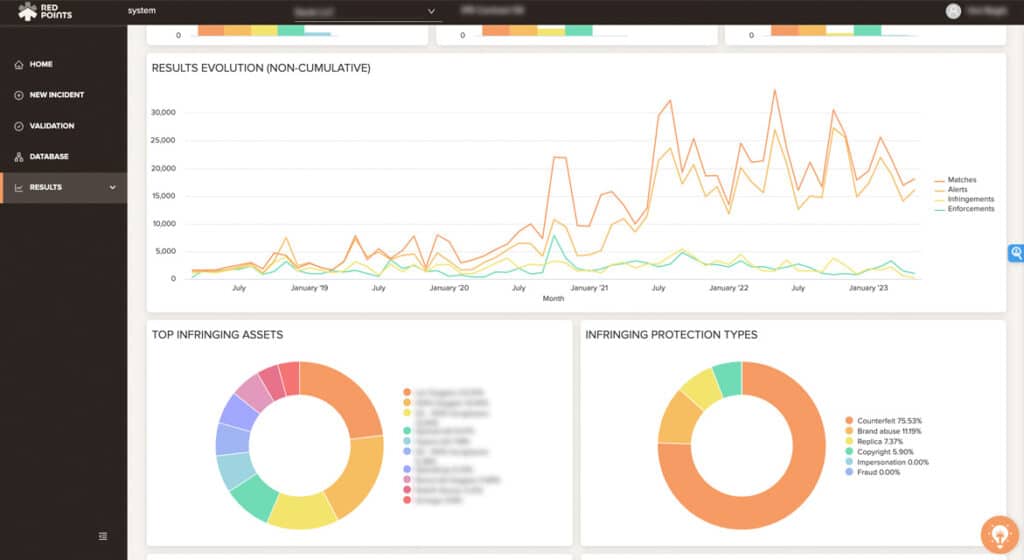
Our Summary dashboard underwent a revamp that increases your business’s ability to receive detailed and easy-to-understand insights about the whole anti-fraud process. For example, we added the capacity to filter by date, asset, or domain within the dashboard. We also integrated the pie charts broadening the ability of businesses to visualize and review relevant data points.
2. Results Analysis
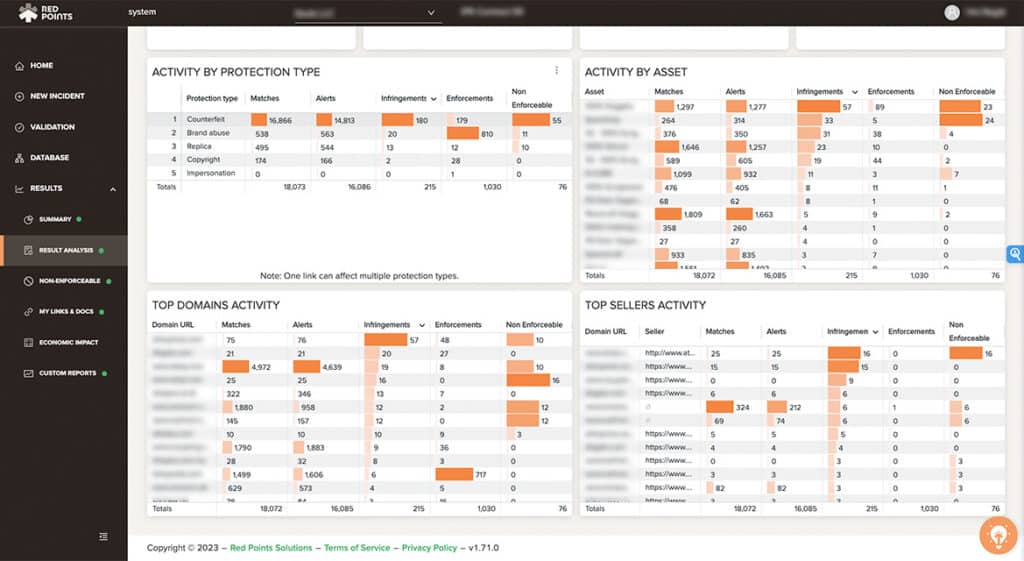
The new version of our Results Analysis dashboard will provide you with a clear picture of the phases that each incident has moved through in the current time period. This analysis will be split by asset, domain, protection type, and seller to ensure your business will get a comprehensive view of results related to bot accuracy, exposure, automatic confirmation and more.
3. Non-enforceable
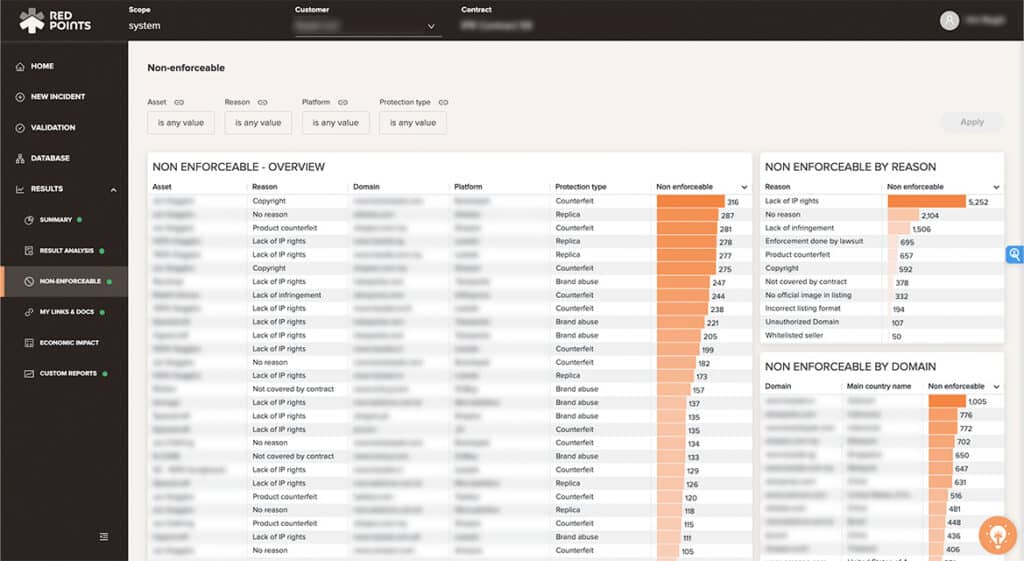
Here businesses can view a summary of all non-enforceable items by reason, asset and domain. Our Non-enforceable overview also provides you with the platform name in question and the type of protection involved whether it be ‘Counterfeit’ or ‘Brand Abuse’.
All of this information will help you reveal where your IP rights may be lacking. This level of reporting and insights is crucial because it will help you make informed, proactive steps to safeguard your intellectual property as your business evolves.
4. Links & Docs
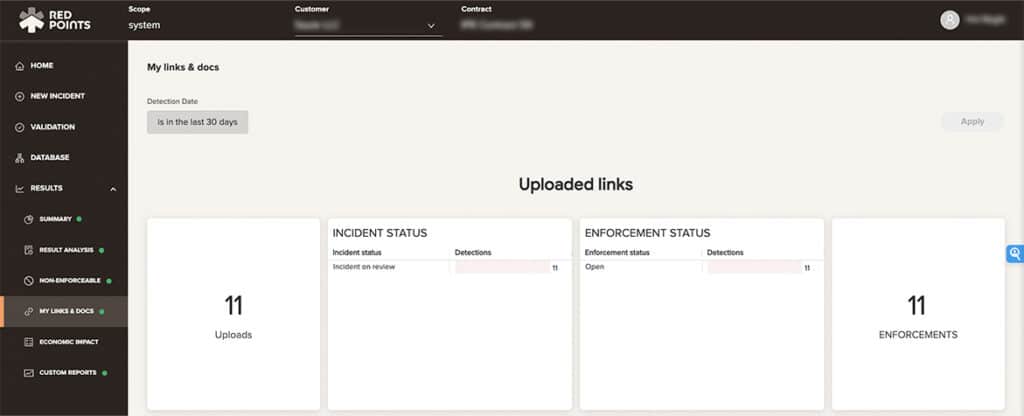
Our Links & Docs dashboards allow you to follow up on incidents that you may have detected online and uploaded onto Red Points’ Portal. Using this dashboard you can track progress with precision using a variety of metrics. Here you can also find out which intellectual property documents we have in our records. Each feature within the Links & Docs dashboards provides you with a breadth of data points that empower you to conduct granular analysis and learn more about which intellectual property rights are the ones used the most, and where you may have gaps.
5. Economic Impact
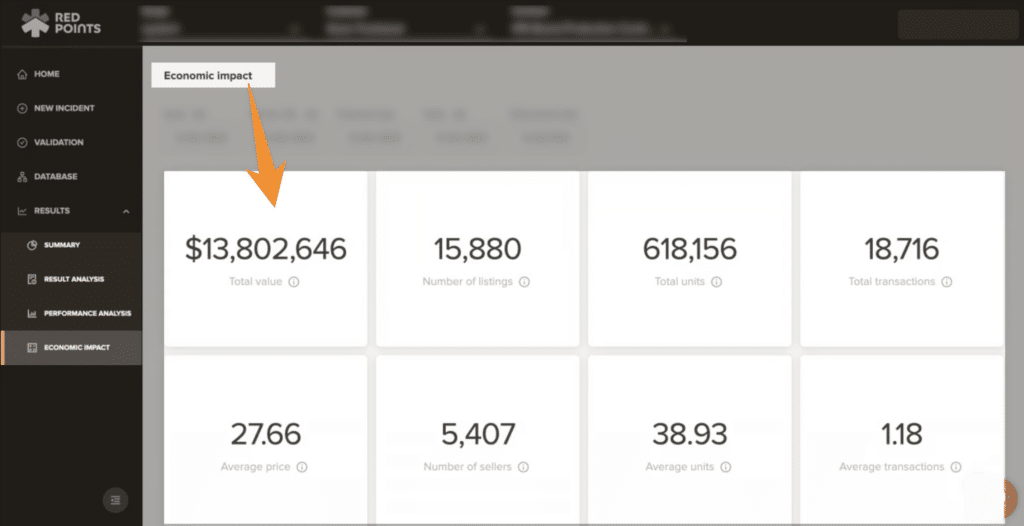
The Economic Impact dashboard allows you to properly quantify how, when and where you are improving your brand and intellectual property protection strategies. Within this dashboard you can see the total value of enforced listings, the number of listings, the total number of recorded transactions, the average price and the number of sellers alongside a host of other useful metrics. The increased visibility you receive via this dashboard will enable you to continually improve your anti-fraud efforts.
6. Custom Reports
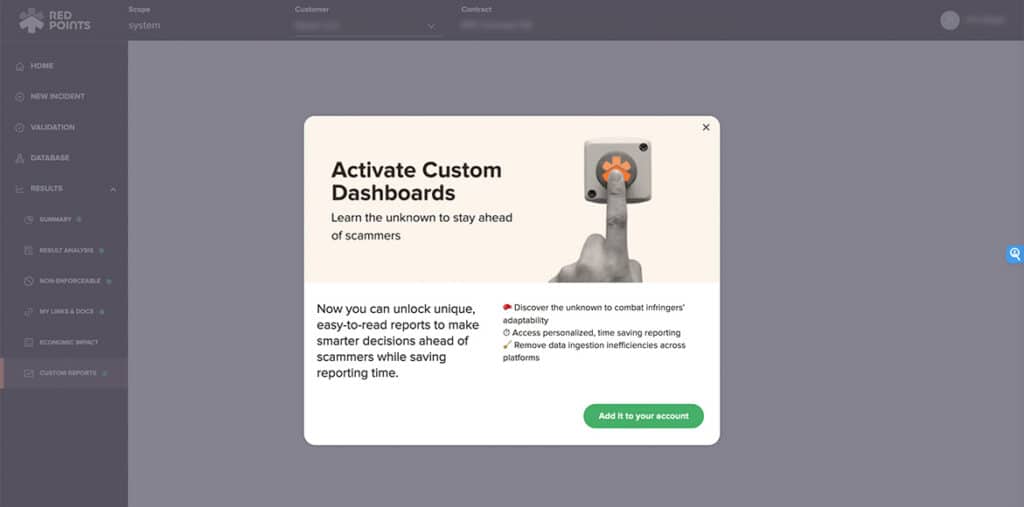
You can use our Custom Reports dashboards to get a personalized overview of your anti-fraud coverage alongside more targeted insights at your request. Here you can tailor your post-enforcement experience to ensure that you are learning as much as you want about the whole price. Custom reports will also help to improve your understanding of your overall revenue recovery efforts.
What’s next
Ultimately, the new Red Points’ anti-fraud dashboards will empower your business to safeguard revenue and proactively protect your brand. It is up to you to decide which ones to prioritize to ensure that you are constantly informed and ready at all times to protect your business’s intellectual property. With greater access to relevant data points and a closer look at personalized analysis, you will be able to better prepare your business for a market that is increasingly flooded with tricky scammers and bad actors.
Each dashboard has been designed with business interests in mind. Summary, Result Analysis, Links & Docs, and the new Non-enforceable dashboard are all tailored to provide you with a breadth and depth of granular insights. Our reporting system enables you to increase your visibility of incidents and anticipate events before they impact your business.
To learn more about how our dashboards revamp can help your business please request a demo today.
